Usage
To run any Opqua model (including the tutorials in the examples/tutorials
folder), save the model as a .py file and execute from the console using
python my_model.py.
You may also run the models from a notebook environment such as Jupyter or an integrated development environment (IDE) such as Spyder, both available through Anaconda.
Minimal example
The simplest model you can make using Opqua looks like this:
# This simulates a pathogen with genome "AAAAAAAAAA" spreading in a single
# population of 100 hosts, 20 of which are initially infected, under example
# preset conditions for host-host transmission.

from opqua.model import Model

my_model = Model()
my_model.newSetup('my_setup', preset='host-host')
my_model.newPopulation('my_population', 'my_setup', num_hosts=100)
my_model.addPathogensToHosts( 'my_population',{'AAAAAAAAAA':20} )
my_model.run(0,100)
data = my_model.saveToDataFrame('my_model.csv')
graph = my_model.compartmentPlot('my_model.png', data)
For more example usage, have a look at the examples folder. For an overview
of how Opqua models work, check out the Materials and Methods section on the
manuscript
here. A
summarized description is shown below in the
How Does Opqua Work? section.
For more information on the details of each function, head over to the
Documentation section.
Example Plots
These are some of the plots Opqua is able to produce, but you can output the
raw simulation data yourself to make your own analyses and plots. These are all
taken from the examples in the examples/tutorials folder—try them out
yourself! See the
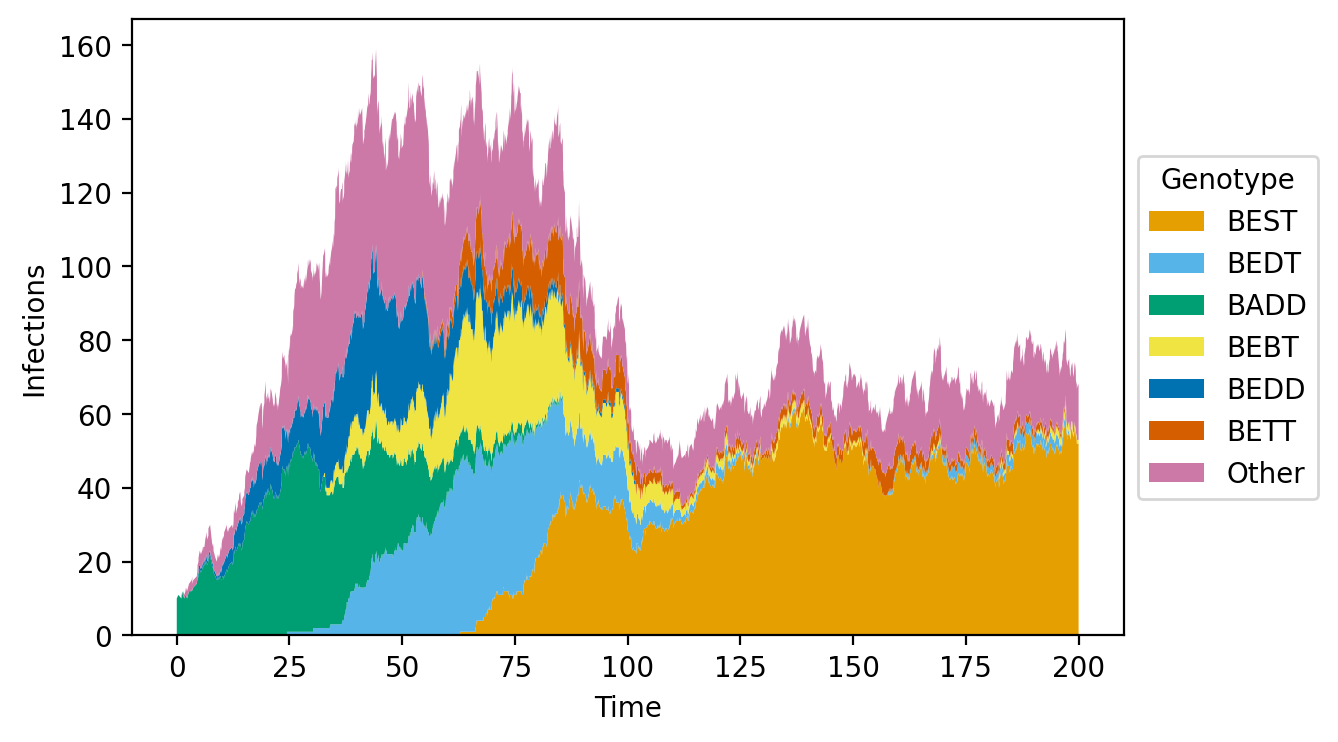
Population genetic composition plots for pathogens
An optimal pathogen genome arises and outcompetes all others through intra-host
competition. See fitness_function_mutation_example.py in the
examples/tutorials/evolution folder.
Host/vector compartment plots
A population with natural birth and death dynamics shows the effects of a
pathogen. “Dead” denotes deaths caused by pathogen infection. See
vector-borne_birth-death_example.py in the examples/tutorials/vital_dynamics
folder.

Plots of a host/vector compartment across different populations in a metapopulation
Pathogens spread through a network of interconnected populations of hosts. Lines
denote infected pathogens. See
metapopulations_migration_example.py in the
examples/tutorials/metapopulations folder.

Host/vector compartment plots
A population undergoes different interventions, including changes in
epidemiological parameters and vaccination. “Recovered” denotes immunized,
uninfected hosts.
See intervention_examples.py in the examples/tutorials/interventions folder.

Pathogen phylogenies
Phylogenies can be computed for pathogen genomes that emerge throughout the
simulation. See fitness_function_mutation_example.py in the
examples/tutorials/evolution folder.

For advanced examples (including multiple parameter sweeps), check out this separate repository (preprint forthcoming).